Publication: The Studio Journal (CreativeTech.Studio) Category: Creative Technology / Building in Public Tags: Creative Technology • Research • Digital Experience Estimated Read Time: 7 min read Lead-Gen Focus: CreativeTech.Studio AI Lab & Custom Creative Technology Consulting Services
1. The Hook & The Core Challenge
Indiana Football’s historic 16–0 campaign—spanning the regular season, Big Ten Championship, and College Football Playoff National Championship—demanded a paradigm shift in sports digital media. Legacy outlets deliver reactive post-game recaps, answering a basic query: “What happened?” The strategic imperative of The 16–0 IU Project was to move past score aggregation and engineer an interactive digital time capsule. Our goal was answering a far more compelling question: “What did it feel like to experience the journey from 1–0 to 16–0?”
“A great digital experience doesn’t just present information—it gives people a reason to explore it.”
Unlocking that level of engagement required first confronting the structural flaws inherent in conventional publishing platforms.
2. The Diagnostic Breakdown: Static Fatigue vs. Narrative Data
Legacy content management systems (CMS) and sports media platforms routinely choke on high-density storytelling. Overlaid with heavy database queries, client-side tracking bloat, third-party ad scripts, and rigid grid layouts, traditional sites transform dramatic athletic runs into flat, administrative tables. When users are forced to wade through static box scores on mobile viewports, cognitive fatigue sets in fast—driving bounce rates up and dwell times down.
The Old Way vs. The CreativeTech Way
| The Old Way (Legacy Media) | The CreativeTech Way (Studio R&D) |
|---|---|
| Philosophy: Passive score aggregation & reactive post-game news recaps | Philosophy: Narrative time capsule & interactive storytelling |
| Architecture: Bloated legacy CMS with heavy database overhead & third-party script bloat | Architecture: Lightweight, low-latency client-side components & decoupled static generation |
| Interaction Model: Passive article reading & static tabular data | Interaction Model: Active exploration via the RELIVE IT / REMEMBER IT / SHARE IT framework |
| R&D Value: One-off, single-use publishing build | R&D Value: Live client-capability sandbox & reusable component library |
Stripping away backend CMS overhead in favor of decoupled static site generation (SSG) and custom vanilla JavaScript components completely changes the digital performance equation. Eliminating server-side DB lookups slashes mobile first-contentful-paint (FCP) times to near-zero, removing micro-stutters during interaction. More importantly, converting raw stats into interactive narrative visualizers elevates audience behavior from quick, passive skimming to deep, active exploration—building a genuine emotional connection with complex sports analytics.
Building an experimental showcase that renders 16 games of dense sports telemetry without lag requires treating internal R&D with the same operational rigor as an enterprise software build.
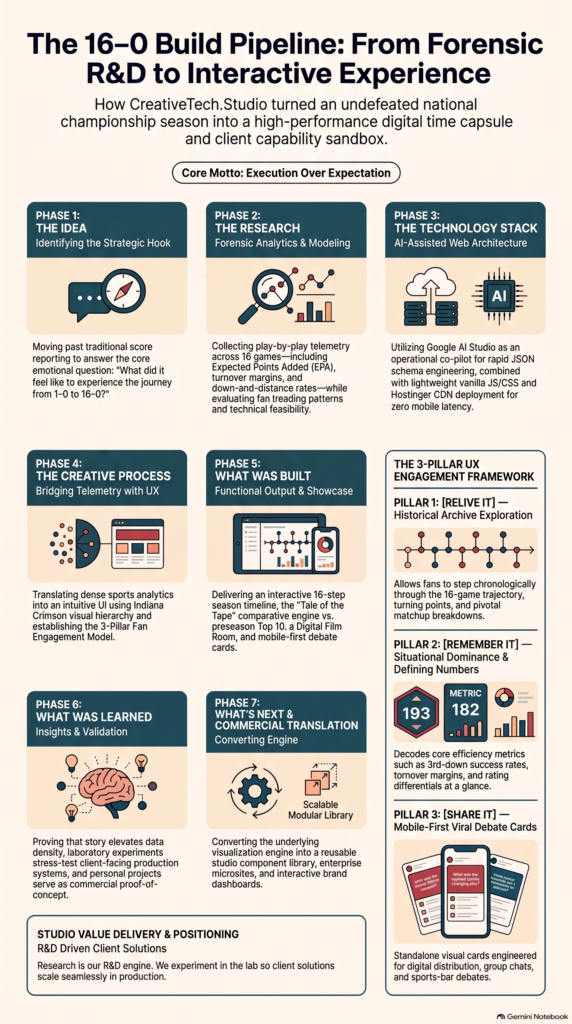
3. Tactical Methodology: The 7-Phase Build Pipeline
Internal studio research only yields commercial value when executed as a disciplined engineering pipeline. The 16–0 IU Project was structured into seven sequential phases to stress-test decoupled frontend performance, structured AI co-pilot workflows, and custom data visualization architectures.
1. Phase 1: The Idea (The Strategic Hook)
The project premise was rooted in expectations disconfirmation: pitting preseason media narratives against empirical, on-field execution (“Execution Over Expectation”). The strategic objective was evaluating how creative technology and interactive data visualization could redefine post-season archive experiences.
2. Phase 2: Forensic Analytics & Data Structuring
We conducted a deep analytical audit across Indiana’s 16-game championship run. The resulting dataset aggregated 53 telemetry variables across 11 opponent datasets—normalizing play-by-play logs, Expected Points Added (EPA), turnover differentials, situational success rates, and down-and-distance execution metrics into deterministic JSON schemas.
3. Phase 3: The Technology Stack & Operational AI Co-Pilot
Speed and lightweight execution governed stack selection. Google AI Studio served as our operational co-pilot for rapid prototyping and schema engineering. To prevent prompt drift during iterative output generation, we locked down strict context window parameters and enforced deterministic JSON schemas. Token efficiency was tracked continuously to maximize prompt signal and eliminate model hallucination. The production code was written in pure vanilla JavaScript and optimized CSS—bypassing heavy frontend frameworks entirely—and deployed on Hostinger edge delivery.
4. Phase 4: Creative Process & The 3-Pillar UX Framework
The visual architecture paired Indiana Football’s identity with studio-grade design standards, strictly governed by the CreativeTech.Studio brand palette: Ink (#221113) for primary text and structure, Teal (#14505F) for UI containers and blueprints, Red (#E31C2F) as a sparse accent, and Cream (#ECECE8) for backgrounds. Display headings were set in geometric Sora (600/700 weight), paired with Inter (400/500 weight) for clean body copy readability. Interaction was mapped across three functional pillars:
5. Phase 5: Functional Output & Client-Side State Architecture
Rendering 16 dynamic game modules on a single responsive page without frontend framework bloat (such as React or Vue) required engineering a custom client-side state router in vanilla JavaScript. Game data schemas were loaded into memory as lightweight, immutably structured JSON objects. UI state transitions were handled via direct DOM manipulation and CSS transform triggers, maintaining a persistent, lightning-fast 16-step season timeline alongside detailed game breakdown modules.
6. Phase 6: Performance Optimization & Rendering Engineering
To prevent UI lag and layout shifts on low-bandwidth mobile networks, we established strict execution guardrails. Heavy third-party charting libraries (like D3.js or Chart.js) were deliberately rejected due to their massive bundle sizes and DOM overhead. Instead, we engineered custom, inline SVG and HTML5 Canvas rendering routines for win probability curves and EPA trend graphs. This choice kept total asset payloads minimal, guaranteed 60fps scrolling performance, and eliminated visual repaints.
7. Phase 7: Translation to Enterprise Client Work
The experimental patterns developed during this build were systematically cataloged for commercial deployment. The custom timeline components, zero-dependency chart rendering modules, and AI co-pilot schema workflows directly inform our enterprise web builds—exemplifying our core studio ethos: “Engineering over Illusion.”
[SYSTEM PROMPT: CREATIVETECH.STUDIO AI CO-PILOT]
Role: Lead Creative Technology Engineer & UX Architect for CreativeTech.Studio.
Task: Convert raw college football performance data into lightweight, deterministic JSON schemas and generate mobile-first UI components for the 16–0 IU Project.

Strict Constraints:
1. Enforce CreativeTech.Studio Brand Palette: Ink (#221113) for primary text/structure, Teal (#14505F) for secondary UI/blueprints, Red (#E31C2F) for sparse accents, Cream (#ECECE8) for backgrounds.
2. Typography Rules: Headings set in Sora (600/700 weight); body/UI set in Inter (400/500 weight).
3. Data Output Schema: Structure play-by-play data into 53 key variables across 11 opponent datasets.
4. Code Standards: Pure, lightweight vanilla JavaScript and optimized CSS. Zero heavy external dependencies. Ensure dynamic client-side rendering with lightning-fast mobile paint times.
Translating raw JSON telemetry into high-impact visual components required designing functional UI modules built specifically for user engagement.
4. Real-World Findings & Key Visual Features Built
Abstract datasets only become memorable when translated into intentional visual tools. We built three core interactive modules designed to make dense sports analytics immediately accessible and debate-ready.
The “Tale of the Tape” Comparative Engine
The “Tale of the Tape” module provides a side-by-side analytical comparative engine contrasting Indiana’s empirical trajectory against preseason media consensus. The engine visually highlights expectation disconfirmation: while preseason Top 10 programs faltered (such as Texas starting ranked #1 before tumbling to #12), Indiana surged from an unheralded #20 preseason ranking straight to #1 in the nation. The module plots Indiana’s dominating +29.9 scoring margin per game and their undefeated 8–0 record against ranked opponents, exposing the dramatic gap between subjective polling and actual on-field execution.
The Digital Film Room
To move beyond static box scores, the Digital Film Room visualizes situational execution, tactical adjustments, and momentum shifts across all 16 games. Utilizing custom lightweight SVG/Canvas rendering paths, this module plots game-by-game win probability curves, Expected Points Added (EPA) trajectories, and down-and-distance success rates. During Indiana’s College Football Playoff run, for example, the Film Room illustrates how second-half defensive adjustments forced opponent success rates on 3rd-and-long down to under 18%, turning close contests into decisive victories.
Mobile-First Debate Cards
Engineered explicitly for peer-to-peer distribution, Mobile-First Debate Cards package complex statistical achievements into bite-sized, high-contrast visual callouts. Framed in structured Ink (#221113) and Teal (#14505F) containers with bold Sora display typography and Red (#E31C2F) focal accents, these cards highlight game-defining metrics and milestone achievements. Optimized for smartphone viewports, they allow fans to quickly capture screenshots or share visual proof directly into group chats and live sports bar debates.
These functional UI components provided actionable insights into how studio R&D directly elevates commercial engineering projects.
5. Executive Key Takeaways: Lessons for Enterprise Builds
Treating internal studio projects as full-scale R&D pipelines provides a risk-free testing ground for enterprise digital products. The 16–0 IU Project yields three strategic takeaways for business leaders and technology executives:
This strategy-first, engineering-first approach defines how CreativeTech.Studio designs and delivers enterprise digital systems.
6. Contextual Call-to-Action & Lead Generation
At CreativeTech.Studio, we focus on modern web architecture, interactive data storytelling, and practical AI systems that drive measurable business results. Through our transparent workshop approach, we turn complex technical challenges into clean, high-performance digital reality.
CREATIVETECH.STUDIO AI LAB & CONSULTING
[ Explore the AI Lab ] Review active system prompt frameworks, LLM evaluation matrices, and interactive prompt sandboxes. ➔ creativetech.studio/ai-lab
[ Experience the Live 16–0 IU Demo ] Interact with the full undefeated season digital time capsule hosted on Hostinger edge delivery. ➔ 16–0 IU Live Experience
[ Work With CreativeTech.Studio ] Consult with our team on custom web architecture, interactive data engines, and practical AI integration. ➔ Start a Project